Debugging Python Applications Like a Pro: Advanced PyCharm Techniques
Master PyCharm's powerful debugging tools including breakpoints, watches, and the interactive debugger console. This tutorial covers real-world debugging scenarios, performance profiling, and troubleshooting techniques that will help you solve complex Python issues faster.
Introduction to Professional Debugging
Debugging is an essential skill for every Python developer, yet many programmers rely on simple print statements or basic debugging techniques. PyCharm offers a sophisticated debugging environment that can dramatically improve your productivity and help you solve complex issues that would otherwise take hours to track down.
In this comprehensive tutorial, we'll explore advanced debugging techniques that professional developers use daily. Whether you're troubleshooting a production issue, optimizing performance, or simply trying to understand complex code behavior, these techniques will become invaluable tools in your development workflow.
Pro Tip: The techniques covered in this tutorial work with PyCharm Professional and Community editions. Some advanced profiling features require the Professional edition.
Understanding Breakpoints: Beyond the Basics
Breakpoints are the foundation of effective debugging, but PyCharm offers much more than simple line breakpoints. Understanding the different types of breakpoints and their configurations can save you countless hours of debugging time.
Line Breakpoints with Conditions
The most powerful feature of PyCharm breakpoints is the ability to add conditions. Instead of stopping at every iteration of a loop, you can configure breakpoints to trigger only when specific conditions are met. This is particularly useful when debugging issues that occur only with certain data values or after multiple iterations.
def process_transactions(transactions):
    for i, transaction in enumerate(transactions):
        # Set breakpoint here with condition: transaction.amount > 1000
        result = validate_transaction(transaction)
        if result.is_valid:
            apply_transaction(transaction)
To add a condition, right-click on the breakpoint marker and enter your Python expression. The debugger will only pause when this condition evaluates to True, allowing you to skip irrelevant iterations and focus on the problematic cases.
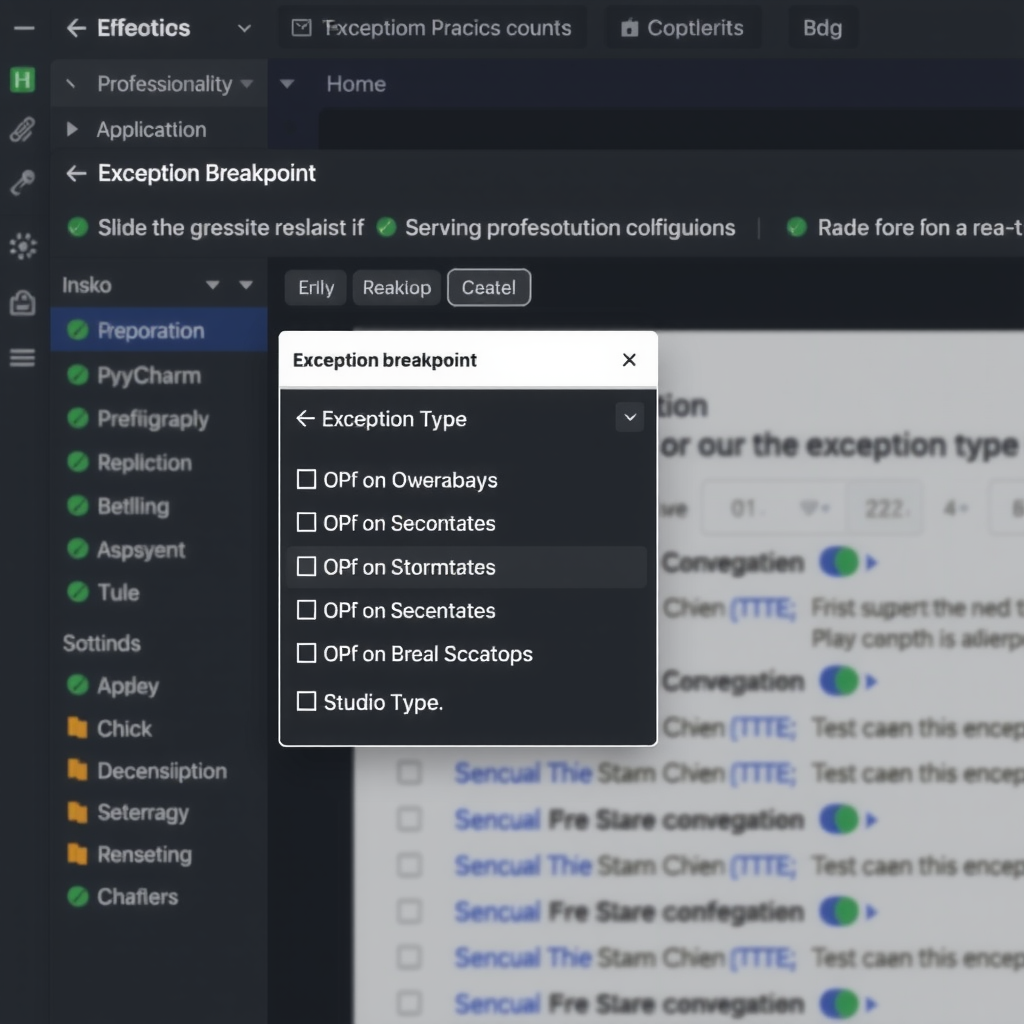
Exception Breakpoints
Exception breakpoints are incredibly powerful for catching errors at their source. Instead of waiting for an exception to propagate up the call stack, you can configure PyCharm to break immediately when a specific exception type is raised, even if it's caught by a try-except block.
To add an exception breakpoint, press Ctrl+Shift+F8 (Cmd+Shift+F8 on Mac) to open the Breakpoints dialog, then click the + button and select Python Exception Breakpoint. You can specify the exact exception type or use a base class to catch multiple related exceptions.
Temporary and Logging Breakpoints
Temporary breakpoints automatically remove themselves after being hit once, perfect for one-time debugging scenarios. Logging breakpoints don't pause execution but instead print expressions to the console, combining the benefits of print debugging with the power of breakpoint conditions.
Mastering the Debug Console
The debug console is one of PyCharm's most underutilized features. When execution is paused at a breakpoint, you have access to a full Python REPL with the current execution context. This means you can inspect variables, call functions, and even modify state on the fly.
# In the debug console, you can:
# 1. Inspect complex data structures
print(json.dumps(user_data, indent=2))

# 2. Test hypotheses about your code
alternative_result = process_data(modified_input)

# 3. Call helper functions to understand state
debug_info = get_system_state()

# 4. Modify variables to test different scenarios
user.role = 'admin'  # Continue execution with modified state
The debug console supports code completion, making it easy to explore object attributes and methods. You can also use it to import additional modules for analysis, such as pprint for better formatting or pandas for data inspection.
Advanced Watch Expressions
Watch expressions allow you to monitor specific values as you step through code. Unlike simple variable inspection, watches can evaluate complex expressions, call methods, and even perform calculations based on multiple variables.
Creating Effective Watches
Good watch expressions focus on the data that matters for your debugging session. Instead of watching individual variables, create expressions that reveal the relationships between data or highlight problematic conditions:
len(items) > 0 and items[0].status == 'pending'- Check collection state[x for x in data if x.value < 0]- Find problematic itemssum(t.amount for t in transactions)- Calculate aggregatestype(result).__name__- Verify object types
Performance Profiling and Optimization
PyCharm Professional includes powerful profiling tools that help identify performance bottlenecks. The profiler can show you exactly where your application spends time, making optimization efforts much more effective.
Using the cProfile Integration
PyCharm integrates seamlessly with Python's cProfile module. To profile your application, right-click on your run configuration and select "Profile" instead of "Run". PyCharm will execute your code with profiling enabled and present the results in an interactive viewer.
The profiler output shows function call counts, total time, and time per call. You can sort by different columns to identify the most expensive operations. The call graph visualization helps you understand how functions relate to each other and where time is actually being spent.
Performance Tip: Focus on optimizing functions with high "tottime" values first. These are the functions where your code actually spends time, as opposed to "cumtime" which includes time spent in called functions.
Memory Profiling
Memory issues can be just as problematic as performance issues. PyCharm supports memory profiling through the memory_profiler package. Install it with pip and use the @profile decorator on functions you want to analyze. The profiler will show line-by-line memory usage, helping you identify memory leaks and excessive allocations.
Real-World Debugging Scenarios
Scenario 1: Debugging Asynchronous Code
Asynchronous Python code can be challenging to debug because execution doesn't follow a linear path. PyCharm's debugger handles async/await syntax seamlessly, allowing you to step through coroutines just like regular functions.
async def fetch_user_data(user_id):
    # Set breakpoint here
    async with aiohttp.ClientSession() as session:
        async with session.get(f'/api/users/{user_id}') as response:
            # Step through to see response data
            data = await response.json()
            return process_user_data(data)
When debugging async code, pay attention to the Threads & Variables panel, which shows all running coroutines. You can switch between different coroutines to understand the full state of your asynchronous application.
Scenario 2: Debugging Multi-threaded Applications
Multi-threaded debugging requires special attention to thread synchronization and race conditions. PyCharm's debugger can pause all threads or just the current thread, giving you control over how you inspect concurrent execution.
Use the Threads panel to see all active threads and their current execution points. You can set breakpoints to trigger only in specific threads by configuring the breakpoint's thread filter. This is invaluable when debugging thread-specific issues.
Scenario 3: Remote Debugging
Sometimes you need to debug code running on a remote server or in a Docker container. PyCharm supports remote debugging through the pydevd package. Configure a remote debug server in PyCharm, then add a few lines to your remote application to connect back to your IDE.
import pydevd_pycharm

# Connect to PyCharm debug server
pydevd_pycharm.settrace('localhost', port=12345,
                        stdoutToServer=True,
                        stderrToServer=True)

# Your application code continues here
# Breakpoints in PyCharm will now work
Advanced Debugging Techniques
Evaluate Expression Dialog
The Evaluate Expression dialog (Alt+F8) is more powerful than the debug console for complex expressions. It provides syntax highlighting, code completion, and the ability to evaluate multi-line code blocks. Use it to test complex logic or perform calculations based on current variable values.
Drop Frame and Force Return
PyCharm allows you to manipulate the call stack during debugging. "Drop Frame" lets you restart execution from an earlier point in the call stack, useful when you want to re-execute a function with modified variables. "Force Return" allows you to exit the current function early with a specific return value, helping you test error handling paths.
Smart Step Into
When a line contains multiple function calls, regular Step Into might not take you where you want to go. Smart Step Into (Shift+F7) shows all callable expressions on the current line and lets you choose which one to step into. This is particularly useful for complex expressions with nested function calls.
Debugging Best Practices
Use Logging Alongside Debugging
While interactive debugging is powerful, strategic logging provides context that breakpoints can't. Configure Python's logging module to output detailed information about your application's state. PyCharm's console can filter log messages by level, making it easy to focus on relevant information.
Create Debug Configurations
Save time by creating specific debug configurations for different scenarios. You can configure environment variables, command-line arguments, and working directories. This is especially useful when debugging different parts of a large application or testing various input scenarios.
Master Keyboard Shortcuts
Efficient debugging requires quick navigation. Learn these essential shortcuts:
- F8 - Step Over: Execute the current line and move to the next
- F7 - Step Into: Enter the function being called
- Shift+F8 - Step Out: Complete the current function and return to caller
- Alt+F9 - Run to Cursor: Continue execution until the cursor position
- F9 - Resume Program: Continue execution until next breakpoint
- Ctrl+F8 - Toggle Breakpoint: Add or remove breakpoint at current line
- Alt+F8 - Evaluate Expression: Open expression evaluation dialog
Troubleshooting Common Issues
Debugger Not Stopping at Breakpoints
If breakpoints aren't working, check that you're running in debug mode (not regular run mode) and that the code being executed matches the file you're editing. PyCharm shows a checkmark on valid breakpoints and a question mark on invalid ones. Ensure your Python interpreter is correctly configured and that you're not running optimized bytecode.
Slow Debugging Performance
Debugging can be slow when inspecting large data structures or when many breakpoints are active. Disable "Collect run-time types information" in the debugger settings if you don't need it. Use conditional breakpoints to reduce unnecessary pauses, and consider using logging breakpoints instead of regular breakpoints for high-frequency code paths.
Variables Not Showing Expected Values
Remember that PyCharm evaluates variables lazily. If you see "..." next to a variable, click it to expand and evaluate. For complex objects, use the debug console to call methods or access attributes that aren't shown in the variables panel. The "Show Variables" option in the debugger settings controls what's displayed automatically.
Conclusion
Mastering PyCharm's debugging tools transforms how you develop Python applications. The techniques covered in this tutorial—from advanced breakpoint configurations to performance profiling—enable you to solve problems faster and write better code. The key is to practice these techniques regularly and integrate them into your daily development workflow.
Start by incorporating one or two advanced techniques into your next debugging session. As you become comfortable with conditional breakpoints and the debug console, gradually add more tools to your repertoire. Before long, you'll find yourself debugging complex issues with confidence and efficiency that would have seemed impossible with basic debugging approaches.
Remember that effective debugging is as much about understanding your code as it is about using tools. PyCharm's debugger gives you unprecedented visibility into your application's behavior, but the insights you gain come from asking the right questions and knowing where to look. Keep learning, keep experimenting, and you'll continue to discover new ways to leverage these powerful debugging capabilities.
Ready to boost your Python productivity?
Download PyCharm today and experience professional-grade Python development with powerful debugging tools, intelligent code completion, and seamless integration with popular frameworks.
Download PyCharm